Exothermic Reactions and Their Exothermic Graphs
Imagine you’re holding a firework sparkler on the Fourth of July. You can feel the heat radiating from it, right? That’s because the sparkler is undergoing an exothermic reaction – a chemical reaction that releases heat! Lots of things around us involve exothermic reactions, from a burning candle to the engine in a car.
Exothermic Graphs: A Picture of Heat
An exothermic reaction is a type of chemical reaction that releases energy in the form of heat. Scientists are super smart, and they’ve come up with a clever way to track the heat released during these reactions: exothermic graphs. You easily see the heat released over time. (Like a picture!)
Think of an exothermic graph like a slide:
- You start at the top of the slide with a bunch of reactants (the stuff that’s going to react). These reactants have a certain amount of energy stored inside them.
- You lose energy as you slide down, and that energy turns into heat. Exothermic reactions work the same way!
- The steeper the slide, the faster you go and the more heat the reaction releases! A steep slide means a fast and furious reaction!
Understanding Exothermic Graphs
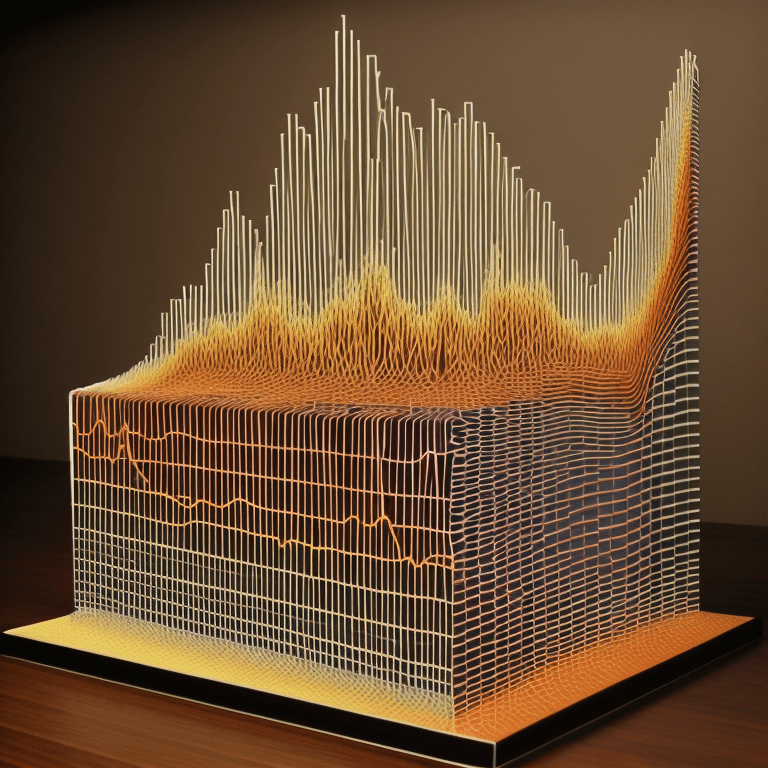
An exothermic graph displays the rate at which a chemical reaction releases energy. This type of graph visually represents the heat energy released to the surroundings during an exothermic process.
Here are seven key features of an exothermic graph:
- Enthalpy Changes: The graph plots the changes in enthalpy (heat content) of the system against either temperature or time.
- Negative Slope: The graph has a negative slope. This downward slope indicates that the system releases heat.
- Downward Displacement: A downward vertical shift on the graph shows the total heat energy output to the surroundings.
- Magnitude of Displacement: This downward slope on the graph shows you how much total heat energy the reaction releases. The more heat released, the further the line drop.
- Common Examples: These graphs represent processes like:
- Crystallization – That’s when you have a liquid, like water, and it cools down and turns into a solid, like ice. This releases heat!
- Rain – Believe it or not, when water vapor in the air condenses to form rain, it actually releases a tiny bit of heat!
- Chemical Reactions – Lots of chemical reactions release heat, like when you burn something or mix certain chemicals.
- Dissolving: Sometimes when you dissolve something in water, like those little hand warmer packets, it releases heat.
- Starting Point: This shows the reactants’ starting heat, before they react.
- Enthalpy Decrease: “Enthalpy” is just a fancy word for heat energy. As the reaction goes forward, the enthalpy decreases. This means the reaction is losing heat energy – it’s releasing that heat into the surroundings!
Basically, an exothermic graph shows a line that slopes downwards. This downward slope means that the reaction is losing heat energy. The bigger the drop in the line, the more heat energy the reaction releases!
Explain It To A Child
An exothermic graph shows how much heat a chemical reaction gives out. Imagine that slide! Sliding further down results in more heat release.
An exothermic graph is like a slide that shows how much heat a chemical reaction gives off. The horizontal line (x-axis) usually shows the amount of reactants or time. The vertical line (y-axis) shows the heat released.
This graph shows you exactly how much heat is released over time.
What is an exothermic graph: Video
An exothermic graph is a visual representation of how much heat is released during a chemical reaction. Watch this video for more useful information about Exothermic Graphs.
Why Are Exothermic Graphs Important?
Scientists use exothermic graphs for all sorts of amazing things! They help them:
- Understand reactions: Scientists use the graph to see a reaction’s speed and heat release.
- Improve safety: Exothermic reactions can sometimes be dangerous if they release too much heat too quickly (think explosions!). Graphs help scientists figure out how to keep reactions safe and prevent accidents.
- Invent new things: We make many useful products, like medicines and phone materials, using exothermic reactions. Graphs help scientists control these reactions precisely to make the things we need.
Real-Life Examples of Exothermic Reactions
An exothermic reaction is a chemical reaction that releases energy through heat. In most cases, this heat dissipates into the surrounding environment. As a result, industries and businesses often use exothermic reactions in applications that require thermal energy. For example, many types of welding rely on exothermic reactions to generate the high temperatures needed to melt metal.
Exothermic reactions are happening all around us, every day! Here are a few more cool examples:
- Burning a candle: When you light a candle, the flame gives off heat and light. This exothermic reaction transforms the wax, releasing heat and light energy.
- Welding metal: Welders use the intense heat from exothermic reactions to melt metal and join pieces together. This is how they build things like cars, bridges, and skyscrapers! Exothermic reactions are essential for welding, which creates high temperatures to make strong vehicle repairs.
- Hand warmers: Those little packets you use in the winter to keep your hands warm work through an exothermic reaction. When you activate the hand warmer, chemicals inside mix and react, releasing heat to keep your fingers toasty!
- Carbon dioxide and water: Imagine you have a glass of cold water. You start bubbling carbon dioxide gas into the water. As the CO2 dissolves, the water will actually warm up slightly because the reaction releases heat, thereby raising the overall heat of solution!

Exothermic vs Endothermic
Endothermic reactions are kind of the opposite of exothermic reactions. Instead of releasing heat, they actually absorb it from their surroundings.
Think of it like this: an ice pack gets cold because it’s sucking up heat from its surroundings. That’s an endothermic reaction in action!
Now, both exothermic and endothermic reactions involve something called ‘entropy,’ which is a measure of disorder or randomness. Exothermic reactions don’t need much help to get started. They have a lower ‘activation energy,’ which means they can happen more easily.
As a result, exothermic reactions tend to be faster and more energetic.
Keeping Things Safe With Exothermic Reactions
Whenever one of these chemical reactions happens, it has the potential to release energy. This energy can take many forms: heat, light, sound, or even electricity! All chemical reactions have stored energy ready to release!
Often, this release of energy is a good thing. Starting a fire is an exothermic reaction that releases heat and light.
But sometimes, this energy release can be dangerous. Remember those exploding fireworks we discussed? If an exothermic reaction releases too much energy too quickly, it can cause an explosion.
That’s where exothermic graphs come in!
Here’s how it works:
- Tracking the Heat: Scientists use exothermic graphs to track how quickly a reaction releases heat. They can see if the heat is increasing slowly or shooting up rapidly.
- Predicting Danger: By studying these graphs, scientists can figure out when a reaction might become dangerous. If the graph shows heat increasing quickly, or if the temperature gets too high, the reaction might become dangerous.
- Developing Safety Procedures: With this knowledge, scientists can develop safety procedures to prevent accidents. They might recommend using cooling techniques to keep the reaction from getting too hot. Scientists might use an “inert gas shroud” to prevent explosions. This is similar to a protective blanket that keeps oxygen away from the reaction.
Scientists use their knowledge of exothermic reactions and graphs to ensure safety in labs, factories, and homes.
The Future Is Bright!
Exothermic graphs have helped us learn a lot about chemical reactions, but there’s still so much more to discover! These graphs might help us solve mysteries about the universe, like dark matter and energy. They could also help us create amazing new technologies, like super-fast spaceships that can travel to other stars!
The possibilities are truly endless!
Fire and hand warmers get hot because of exothermic reactions. We use graphs to understand these reactions!
We should always keep learning and exploring! We have so much more to discover about the universe and how things work.
Article Sources
Jacks of Science sources the most authoritative, trustworthy, and highly recognized institutions for our article research. Learn more about our Editorial Teams process and diligence in verifying the accuracy of every article we publish.